
Article
17 May 2025
Send Aggregated Airtable Data to Google Sheets Using Make
Learn how to pull and aggregate data from Airtable using Make’s aggregator module and send structured summaries to Google Sheets. Ideal for reporting, analysis, and dashboard workflows.
Introduction
In today’s fast-paced world, businesses are looking for ways to improve efficiency and reduce costs. One of the biggest debates is whether AI automation outperforms manual work in terms of time savings and cost-effectiveness. While traditional methods have been the backbone of many industries, AI is rapidly changing the game. In this article, we’ll compare AI-driven automation with manual processes to see which one offers the most value.
How the Automation Works: Step-by-Step
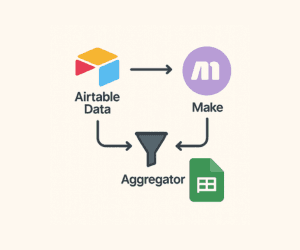
1. Pull Data from Airtable
Use the Airtable “Search Records” or “Watch Records” module in Make to fetch the relevant data from your base.
Why it's useful: You can target specific tables or filter by views/tags for focused reporting.
2. Use the Aggregator Module
Add the Aggregator in Make to group data by category, sum totals, or compute averages (e.g., total sales by month, tickets by agent, etc.).
Why it's useful: This condenses raw Airtable records into a structured summary.
3. Format the Aggregated Output
Use tools like Text Aggregator, Set Variable, or JSON Parser to clean and prepare your summary row-wise.
Why it's useful: It ensures the final result is ready for Google Sheets in a readable format.
4. Send to Google Sheets
Use the Google Sheets “Add Row” module to export the final aggregated data into a report sheet.
Why it's useful: It gives you an auto-updating report in Sheets for easy sharing, visualization, or further automation.
Why Automate This Flow?
Live Reporting: Your Google Sheet always has the latest summary data.
Team Visibility: Non-Airtable users can view reports in a familiar format (Sheets).
Saves Time: Skip manual exports and formula headaches—get it done in Make.
Perfect for Dashboards: Use this output as a base for charts, alerts, or analytics.
Highly Customizable: Add filters, conditions, date logic, or even triggers based on data change.